Bagaimanakah New Normal Pelayanan Publik di masa kini, terutama setelah pandemi ini yang mengharuskan kita 'hidup bersama' dengan virus Corona.
Ini adalah satu satu contoh bagus dan sangat tepat yang dilakukan di Desa Genteng Wetan, Banyuwangi.
Mari kita pelajari bersama..
Pertama, faktor infrastruktur. Kantor pelayanan publik di tingkat terkecil di Kabupaten Banyuwangi ini semua telah terhubung dengan jaringan FIBER OPTIC. Dengan demikian tidak akan ada kendala untuk aplikasi apapun dipasang disana.
Kedua, Banyuwangi mengembangkan aplikasi SMART KAMPUNG. Aplikasi ini memang aplikasi web server yang servernya ada di ruangan kepala desanya. Konsepnya sangat sederhana, dengan tampilan interface web-based, sehingga bisa diakses dari berbagai perangkat. Aplikasi ini juga memungkinkan melakukan konsolidasi dari tiap server di ruang pelayanan publiknya untuk terintegrasi dengan server pusat yang ada di kabupaten. Aplikasi tidak harus kompleks, tapi tepat guna, dan inilah kemudahan dan powerful aplikasi Smart Kampung.
Ketiga, kearifan lokal. Mungkin untuk sebagian orang kantor kepala desa, atau sekarang dikenal juga sebagai kantor pelayanan publik itu harus sangat bagus. Kenyataannya banyak kantor kepala desa seadanya, tapi di dalamnya memiliki kesamaan pelayanan publik yang diberikan. Bila kita datang kesana, hampir di tiap kantor kepala desa itu ada ruangan terbuka yang bisa digunakan untuk berbagai aktifitas, disampingnya ada ruangan atau bahkan saung dimana anak muda desa bisa datang ke sana untuk mengakses Internet. Di video diatas ditunjukkan perkembangan terbaru, dimana salah satu ruang pelayanan publik desa menjadi sangat modern dan memanjakan warganya.
Keempat, tidak perlu biaya mahal. Semua diatas tidak perlu biaya yang sangat mahal, tapi harus tepat guna dan bermanfaat bagi masyarakat sebagai pengguna utama. Bila anda sempat, mampirlah ke mal pelayanan publik di kota Banyuwangi, dan kunjungi salah satu pelayanan publik di desa, Semua sangat terintegrasi, satu tempat dan mereka bisa mengakses apapun, mengurus apapun, hingga bank pun ada di dalamnya. Layanan terintegrasi ini akan memudahkan masyarakat, sehingga tidak harus repot kesana-kesini untuk mengurus surat-surat mereka.
Kelima, tetap memperhatikan kesehatan para pelayan publik. Mungkin yang berbeda saat ini adalah para pelayan publik yang masih muda dan semangat melayani itu akan bersarung tangan, ber-face-shield dan menggunakan masker, sehingga tidak bisa melihat muka cantik dan segar mereka dalam melayani masyarakat. Tapi inilah new-normal yang harus kita jalani di masa pandemi ini, dan sangat mungkin menjadi hal yang biasa dalam beraktifitas selanjutnya.
Inti dari pelayanan publik sendiri tetap adalah melayani publik sebaik mungkin, dan segala daya upaya dapat dilakukan meskipun kita harus hidup berdamai dengan wabah yang ada di sekitar kita saat ini
Sunday, May 24, 2020
Saturday, May 23, 2020
Selamat Hari Raya Idul Fitri 1 Syawal 1441 H

Kami atas nama manajemen dan karyawan PT Daya Cipta Mandiri Solusi mengucapkan Selamat Hari Raya Idul Fitri 1 Syawal 1441 H, Mohon Maaf Lahir dan Batin.
Friday, May 22, 2020
Gunakan MOTADATA Remote Monitoring Free 60 Hari
| ||||||||||||||||||||
| ||||||||||||||||||||
| ||||||||||||||||||||
|

Wednesday, May 20, 2020
Monitoring Microsoft Direct Access with PRTG
In the time of global crisis affected by COVID-19, where many companies are working from home, there are different technologies used by end-users to remotely access corporate network infrastructure. These include different types of VPNs and Direct Access. The health of the network infrastructure and the quality of the remote connections is directly related to the business and customer satisfaction. Based on this, it is highly important to have all business services up and running. The proper medicine is in being proactive and monitoring and managing the health state of remote connections by using the right monitoring tool, PRTG Network Monitor. We have already discussed how PRTG can monitor VPN connections before. If you missed it, check this link.
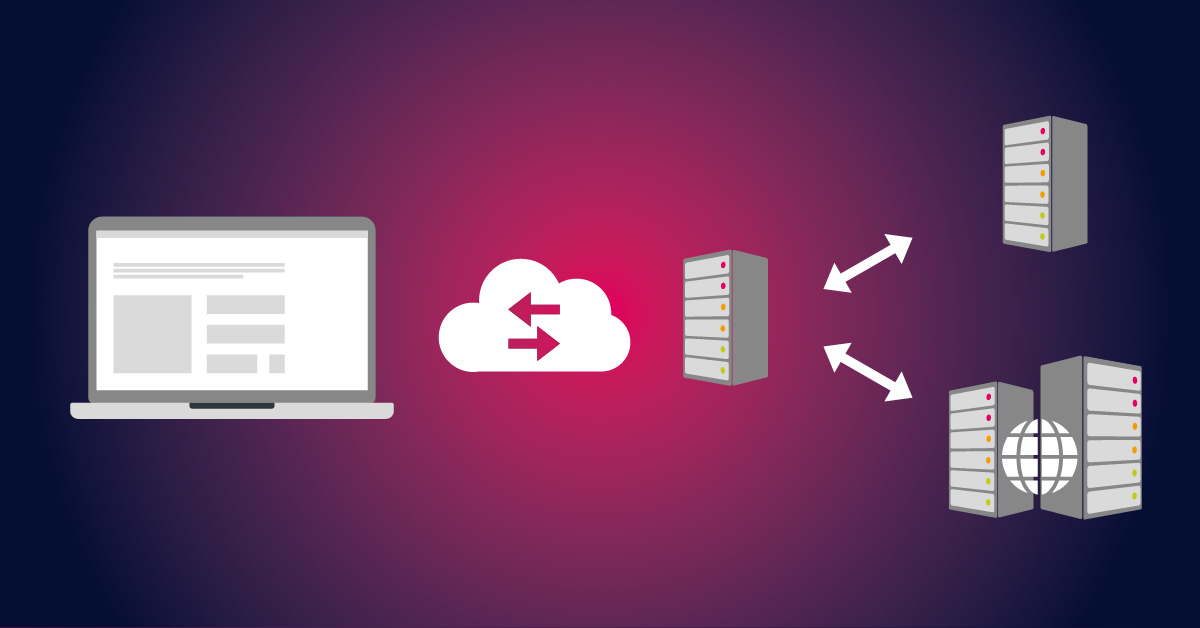
As we at Paessler use Microsoft Direct Access from an IT admin and end-user perspective, we will show you how PRTG can monitor and visualize the health state of Direct Access and all involved components. Microsoft Direct Access is technology presented by Microsoft in Windows Server 2008 R2 and is still available in Windows Server 2019. It establishes bi-directional connectivity with an internal network every time a DirectAccess-enabled computer connects to the Internet. Thanks to the way Direct Access is designed, there is no need for an on-demand connection to the core network as with traditional VPN.
As many different components are involved in the successful deployment of Microsoft Direct Access, the best practice is to do monitoring from the different layers, from physical to application layer. PRTG Network Monitor can cover network infrastructure by using native sensors for monitoring the the health status and traffic of the physical and virtual machines, switches, routers and firewalls, operating systems, different server roles and applications.
Three sensors can help us to monitor the health and connection statistics of standalone or clustered Direct Access servers, including EXE/Script Advanced Sensor, HTTP Push Data Advanced Sensor, and Sensor Factory Sensor. Thanks to these sensors and PowerShell scripts that are developed by our awesome IT team, PRTG can keep an eye on your Direct Access.
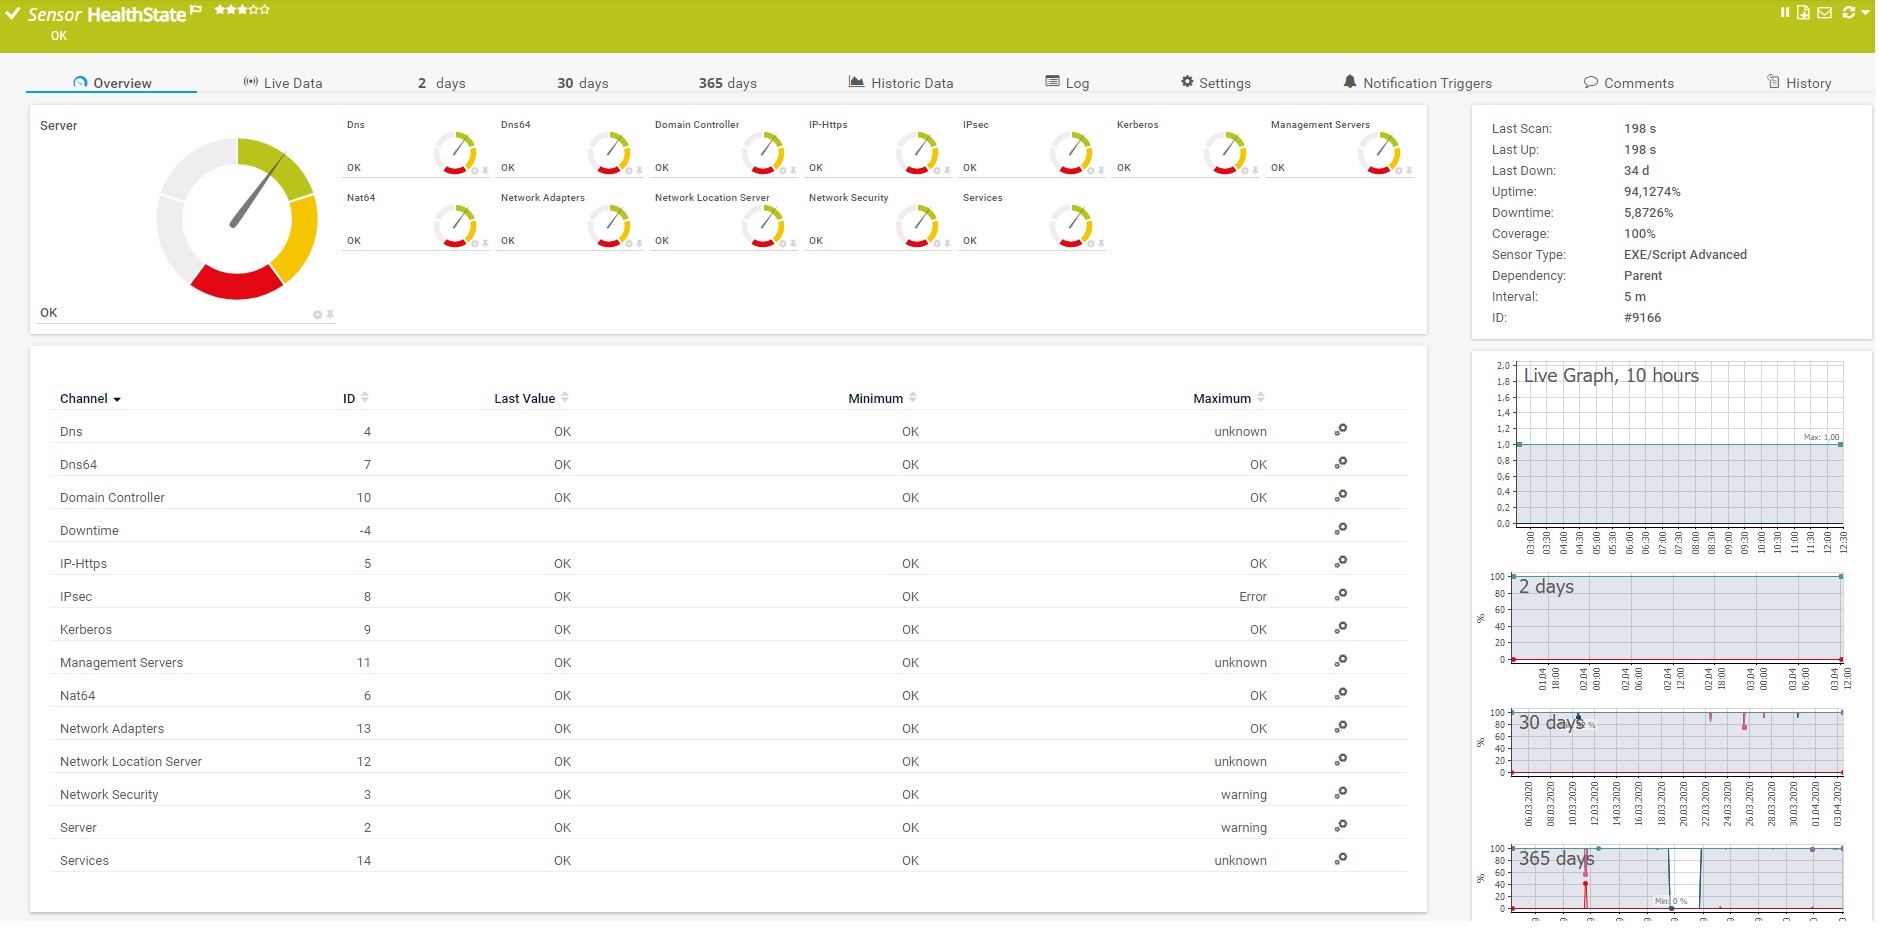
Health of your Direct Access components
By using a PowerShell script, PRTG Network Monitor can get the health state of different components that are involved in Direct Access environments, such as Active Directory, DNS, Network Location Server, Network Security, IPsec, Kerberos authentication, network cards and more. Please download the PowerShell script HealthState.ps1 inlcuding the .ovl file here as zipped file and integrate it into PRTG Network Monitor by using EXE/Script Advanced Sensor. Also, do not forget that PRTG Network Monitor also supports native sensors for monitoring of Active Directory, DNS and Windows services.
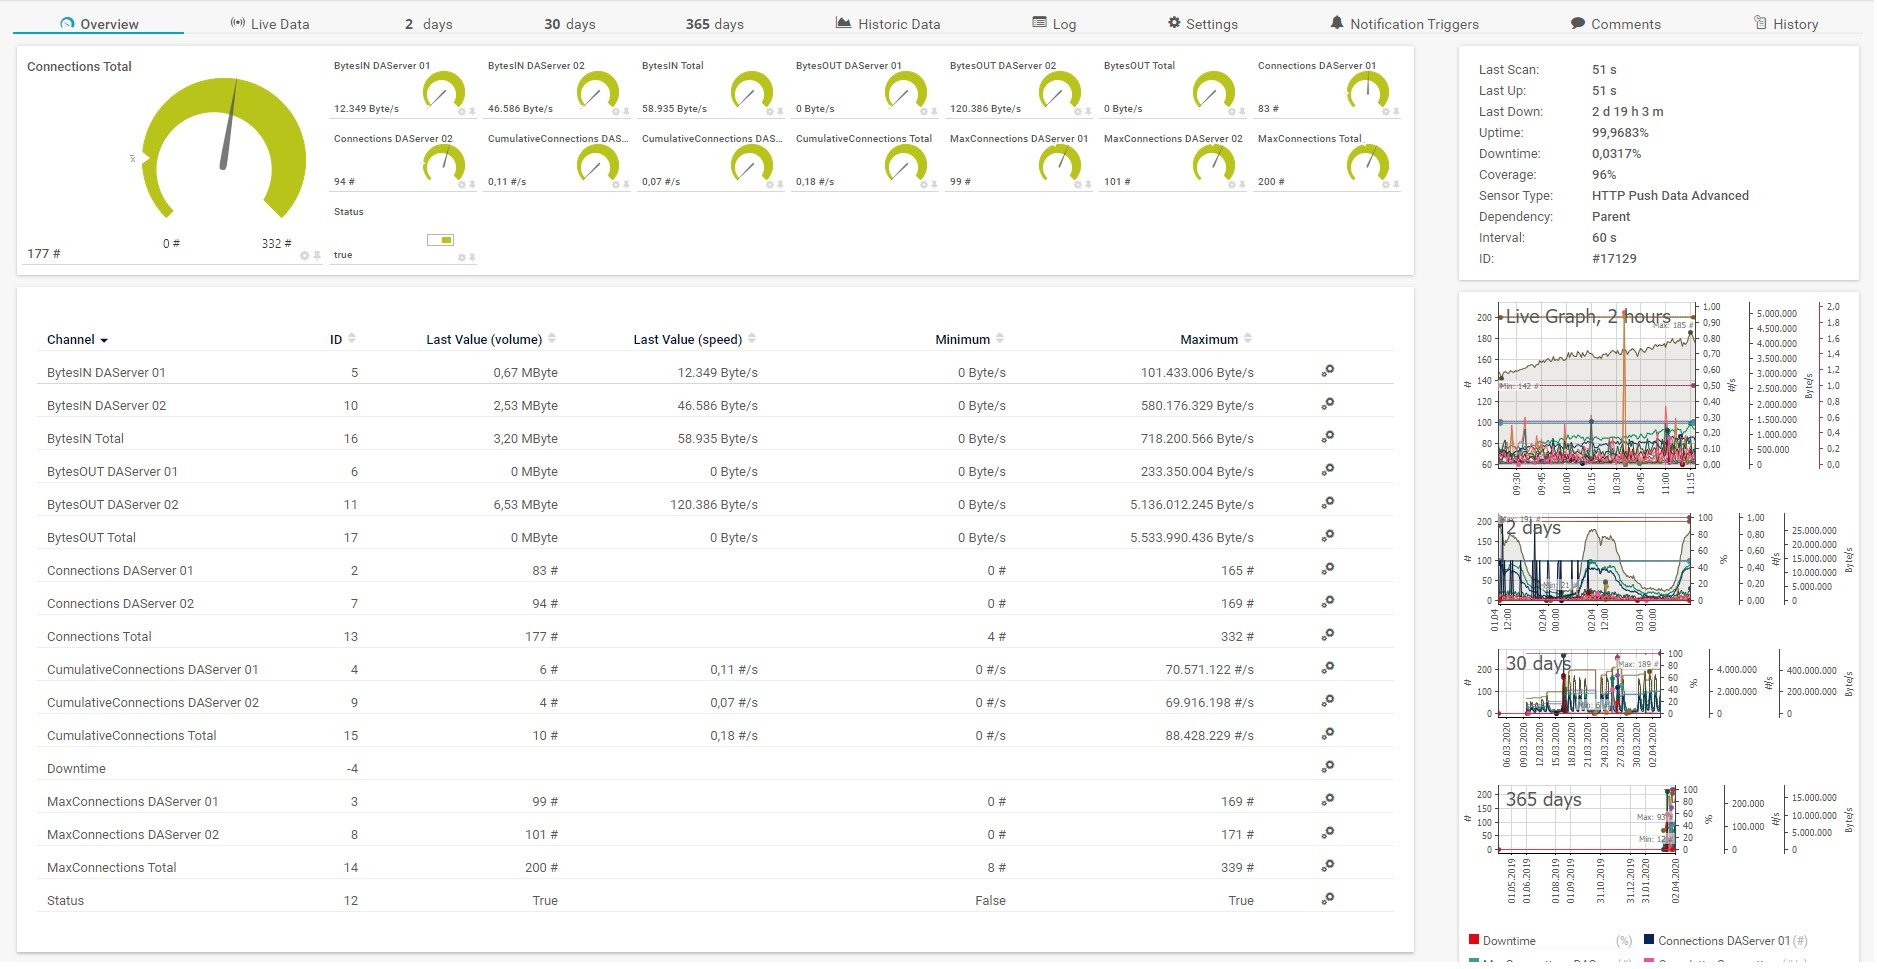
Active connections and traffic
If there is Direct Access Cluster – NLB (Network Load Balancing) in a network, Direct Access servers will be able to do a balancing of active remote connections to minimize the load on the single server. It is therefore important to keep an eye on active remote connections and incoming and outgoing traffic. Thanks to HTTP Push Data Advanced Sensor and the PowerShell script Get-ConnectionStatistics.ps1 , PRTG will be able to show these values within the sensor.
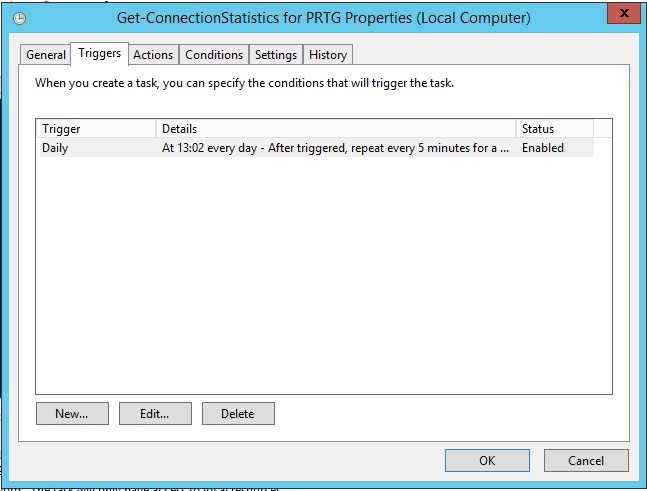
This sensor is implemented as a scheduled task running directly on one of the Direct Access servers. To get a 1-minute resolution in PRTG Network Monitor, it is necessary to run the script every 5 minutes (which is the smallest interval to set up) as the script itself triggers 5 queries and pushes internally. This way you can get information every minute. More information about configuring the scheduled tasks is explained below.
The steps for configuring tasks in Task Scheduler:
- Open Task Scheduler
- Create a new task
- Type the name and then select "Run with highest privilege"

- Configure a trigger to run the script every 5 minutes. The script itself triggers the query/push 5 times in a 60 seconds interval, as the smallest interval for repeating a scheduled task is 5 minutes in Windows. This way we get information every minute.
- Create an action that will start the Get-ConnectionStatistics.ps1 script. The argument that should be added is
-command "& c:\scripts\Get-ConnectionStatistics.ps1 -PRTGBaseURL 'https://<prtgserver fqdn>:<pushsensorPort>' -PRTGToken '<sensorGUID>'"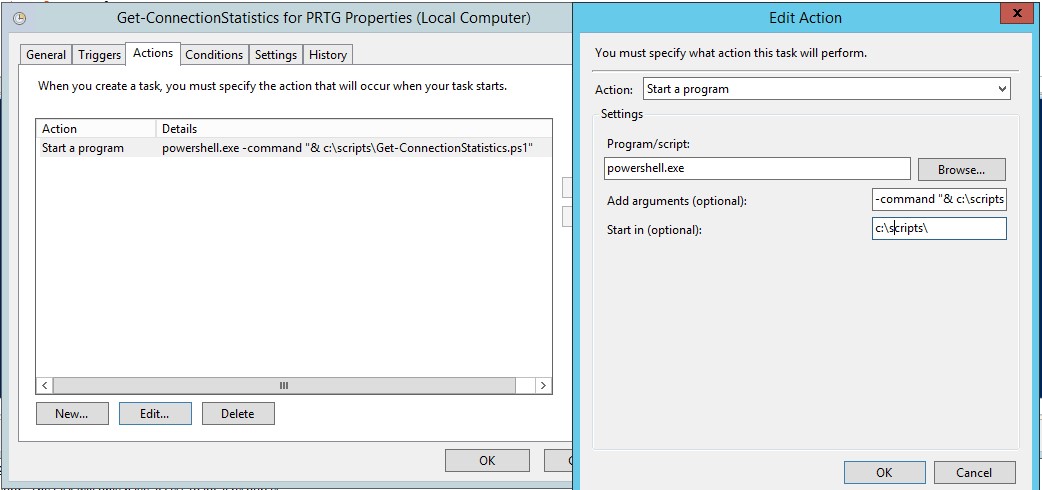
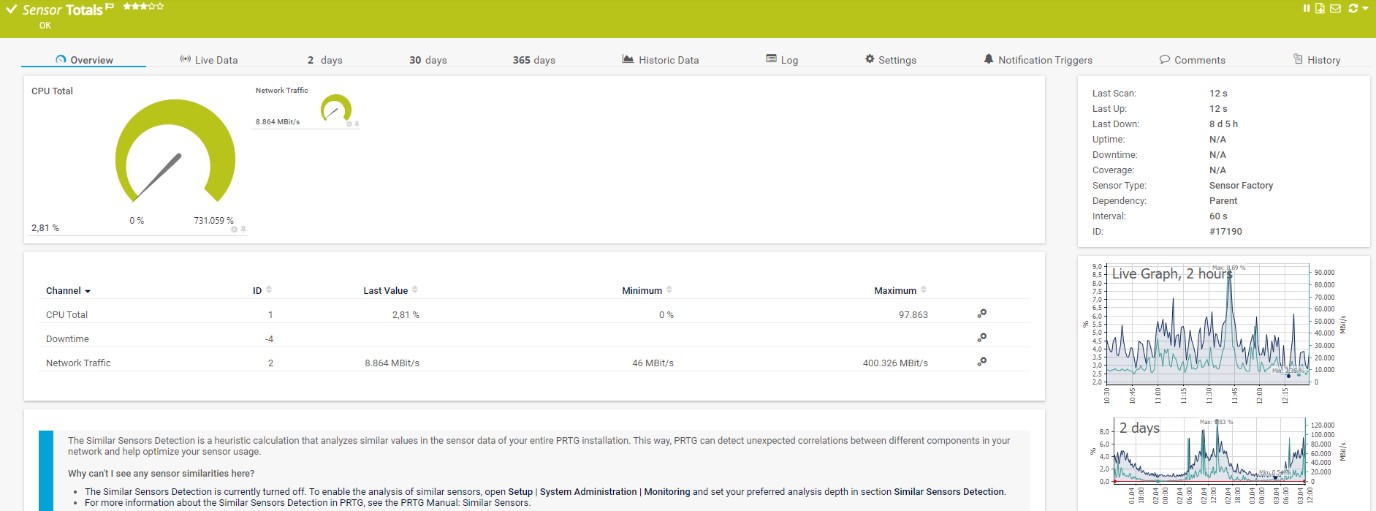
Check loads and bandwidth usage
As Direct Access servers are using multiple network cards for incoming and outgoing communication, it is possible to sum up the consumed network traffic and show the average of the total CPU consumption from both servers. To do so, it is important to set up appropriate limits on the source sensors to see overloads as well as keeping an eye on bandwidth usage on the firewall to avoid bottlenecks. This can be achieved with Sensor Factory Sensor which can combine monitoring results from multiple sensors or devices.
Once all sensors are successfully added into PRTG, the IT admin can also benefit from reporting, maps and notification systems. If you would like to see connection statistics for the previous month, our reporting engine will help you to generate ad-hoc or scheduled Reports in different formats. By using one of the IT admin´s favorite features, Maps, you will be able to visualize the health state of your Direct Access and the whole infrastructure. You can display this on a single map, or rotate several maps on the screen. You can also share it with your teammates.
It could be that you are currently working on awesome IT projects, and that you are not looking at your screen when something in your infrastructure goes down. In this case, PRTG will send you a notification via email or SMS and let you know that you need to check PRTG Network monitor or target devices. There are multiple notification templates that can help you to stay informed and calm.

Tuesday, May 19, 2020
Monitoring from home with PRTG: 3 things to watch in your IT network
The recent move towards remote work in the past few weeks has been nothing short of tremendous. In most cases, IT departments all over the world have just about worked miracles to get it all working (just like ours did). But, as any IT administrator will tell you: the battle is not over. Because it’s one thing to get this all up and running, but another thing to keep it up and running.
Part of the challenge for sysadmins right now is that not only are their users logging in remotely, but so are they. This means that they are far away from the physical server room in their headquarters. So just how do they ensure that everything is running as it should? How can they be alerted when a critical service is down?
The answer to all these questions is the same as when everyone is working in the office: network monitoring. And, if you are using PRTG Network Monitor, here are three things you can (and need to!) keep an eye on when working remotely.
1. Bandwidth
Bandwidth remains key to how fast and effectively users can access and use services and applications. Low bandwidth could result in all kinds of issues that are detrimental for remote work. A stuttering connection to a video conference will make meetings a nightmare, or a slow connection to a service like Microsoft 365 or Confluence could make quick tasks take twice as long to complete. In short, bandwidth is probably the most crucial element to monitor.
Bandwidth is a tricky problem because there are now so many variables that could affect a user’s connection to services—and many of these variables are outside of your control. First, there’s the user’s wireless network at home, which might have countless devices connected to it right now. Then there’s the user's connection to the Internet itself. This is almost impossible to monitor, of course, because you can’t exactly put a PRTG installation in each of your colleagues’ home networks. Well, you could, but I’m pretty sure that would be contravening some kind of privacy laws.
Rather, you’ll have to handle this on an exception basis: if someone complains that they’re having problems with some or other service, you will probably need to start by asking them to run an Internet speed test. This will indicate whether the issue is with their connection to the Internet, or somewhere else.
You can actively monitor what is going in your organization's network, however–even if you are not physically on premises.The trick here is to monitor potential problem spots in the network so that you know when there is traffic congestion – before your users tell you.
There are various ways you can do this with PRTG Network Monitor:
- Use SNMP sensors: Bandwidth monitoring with SNMP will tell you the amount of traffic, over time, on each port.
- Use Flow sensors: PRTG lets you use Flow protocols to identify the devices generating the most traffic, the connections using the most traffic in your network, and so on.
- Use the Packet Sniffer sensor: analyze traffic in your network and produce top lists.
We have written several articles about monitoring bandwidth in the past, but this one is a good place to start: A Step-By-Step Guide: Figure Out Who’s Hogging Your Bandwidth.
2. The VPN
If your workforce logs in to their environment through a Virtual Private Network, you probably now have dozens or even hundreds of remote workers connected. Of course this means you need to be consistently sure that your VPN is functional.
The key aspects to consider with VPN are the traffic in and out of the VPN, and the number of connections. Slow traffic might indicate a potential problem, and knowing the number of currently connected users can help with troubleshooting and diagnosis.
PRTG uses Simple Network Management Protocol (SNMP) for its VPN monitoring. If your VPN environment is based on Cisco ASA or SonicWall devices, PRTG offers a number of default sensors that use SNMP to monitor the VPN traffic, users, and connections of those solutions. If you use another VPN option, you can use PRTG user-defined SNMP sensors. Manufacturers such as Juniper and Fortigate provide MIB files that you can incorporate into PRTG with the SNMP Library Sensor, for example, allowing you to monitor the corresponding VPNs.
3. Teleconferencing tools
There’s no doubt that the glue holding virtual teams together right now is online video meetings. Teleconferencing tools, like Microsoft Teams, Zoom, and others, are the only way that teams can continue working as...well, teams. So of course, these need to be up and running.
While PRTG doesn’t necessarily offer a direct way to keep an eye on these tools, there is a way to do it indirectly. Most services offer either an API or a Website for users to check on the availability of the service. For example: Zoom offers this service status, along with details of an API to query the status. You can use this information in conjunction with the REST Custom sensor in PRTG to get notifications when the service you make use of is down. We'll be posting exactly how to do this in a future post.
Monitoring from home with PRTG
Of course, there are also countless other things to keep track on; the above are just some of the more important ones when a large part of your users are working remotely. PRTG helps you with all of it.
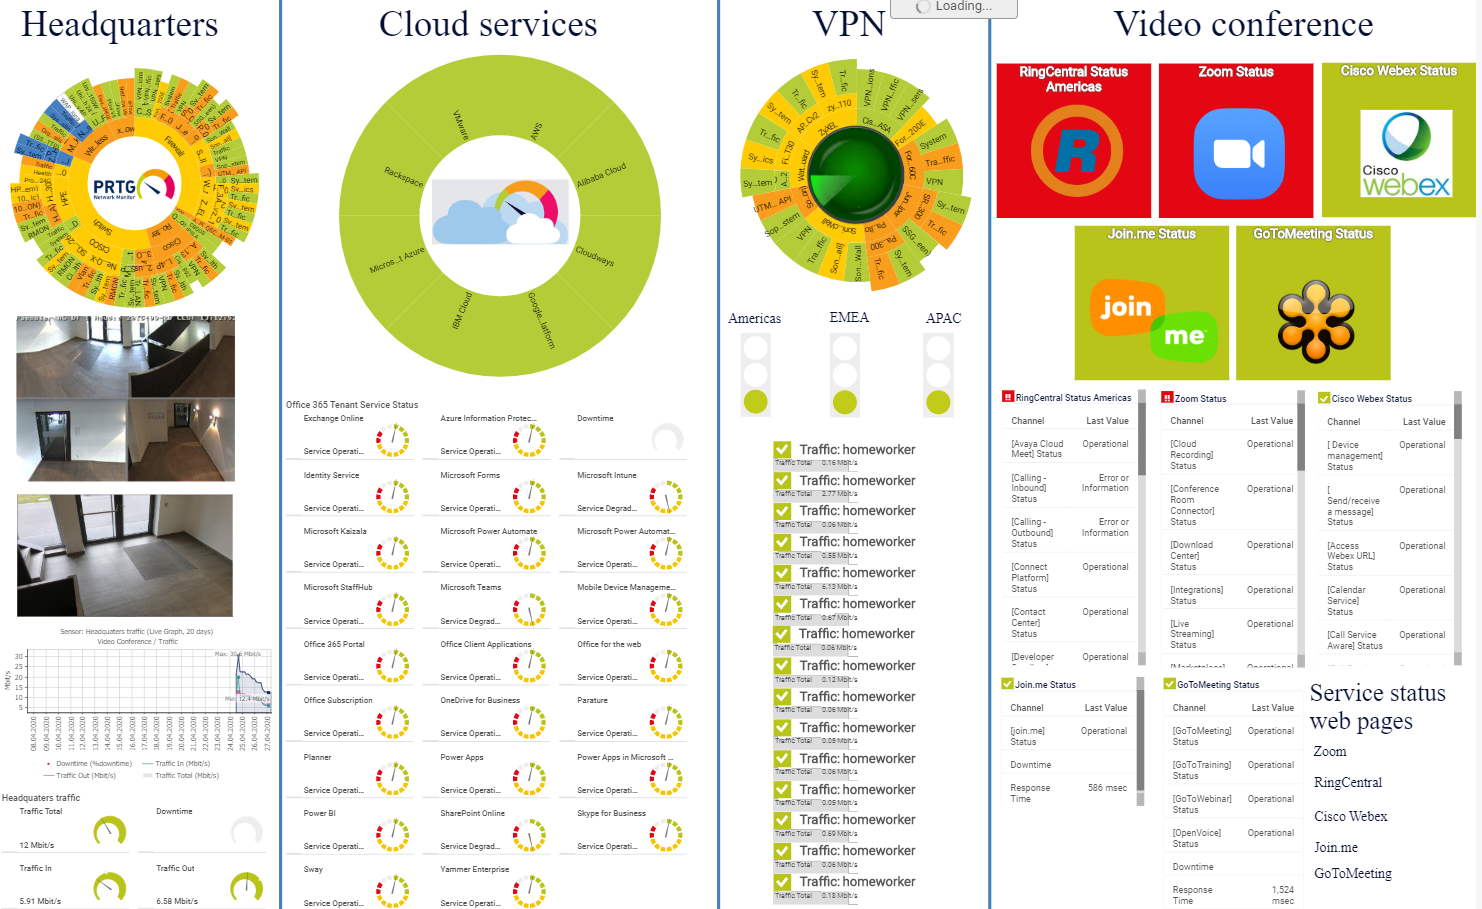
The way that PRTG works is that you install a PRTG server in your environment, which then collects data from your devices infrastructure and network. You can create dashboards and access them from anywhere—even from home 😉
Here's an example of what such a dashboard could look like:
Monday, May 18, 2020
CovidCare: Helping hospitals in the COVID-19 crisis
The current crisis surrounding the SARS-CoV-2 virus, the cause of COVID-19, has had an effect on us as both individuals and as a company. A week ago, our entire team began working remotely from home so that we can stay healthy and maintain the high standards of productivity that our customers are used to. But "staying safe and sound" was not enough for us as employees of Paessler AG; Dirk Paessler, our founder, wanted to go further and use his knowledge and data-driven instincts to develop a tool that would help hospitals and clinics in the current crisis to estimate potential case numbers. To this end, he launched a hackathon last weekend, and we present the result to you here.
How it all began
It all started when Prof. Dr. Harald Dormann, the head physician of the emergency department at the hospital in Fürth, asked Dirk if he could create a small application to estimate the expected rush of inpatients and intensive care patients to his hospital, and especially to the emergency department. The underlying, very realistic fear: the clinic could run out of intensive care beds due to an unknown number of coronavirus patients; every other hospital in Germany is currently facing the same issue. The state-wide data is unsuitable for the detailed planning of hospitals at the community level, because the virus outbreak has progressed differently in each region of Germany (and Europe) and the rush, in particular for intensive care units, must therefore be calculated separately for each region.
On the afternoon of Friday March 20, Dirk put version 2 online as a spreadsheet. It immediately garnered great interest on the internet - more than 2,000 people visited the website within 24 hours. Also on Friday, Dirk initiated the aforementioned hackathon. The Paessler Board of Directors supported the project wholeheartedly, and within 2 hours we had virtually gathered more than 20 internet and software specialists who wanted to help – no matter how, whether during working hours or in their free time – in a slack channel. Everyone wanted to do something in this time of crisis!
Let us present: CovidCare
CovidCare offers hospital managers, doctors and other health care personnel the possibility of predicting potential scenarios based on a case number analysis. Special focus is placed on the required emergency room capacity, inpatient supplies, as well as intensive care and ventilation resources.
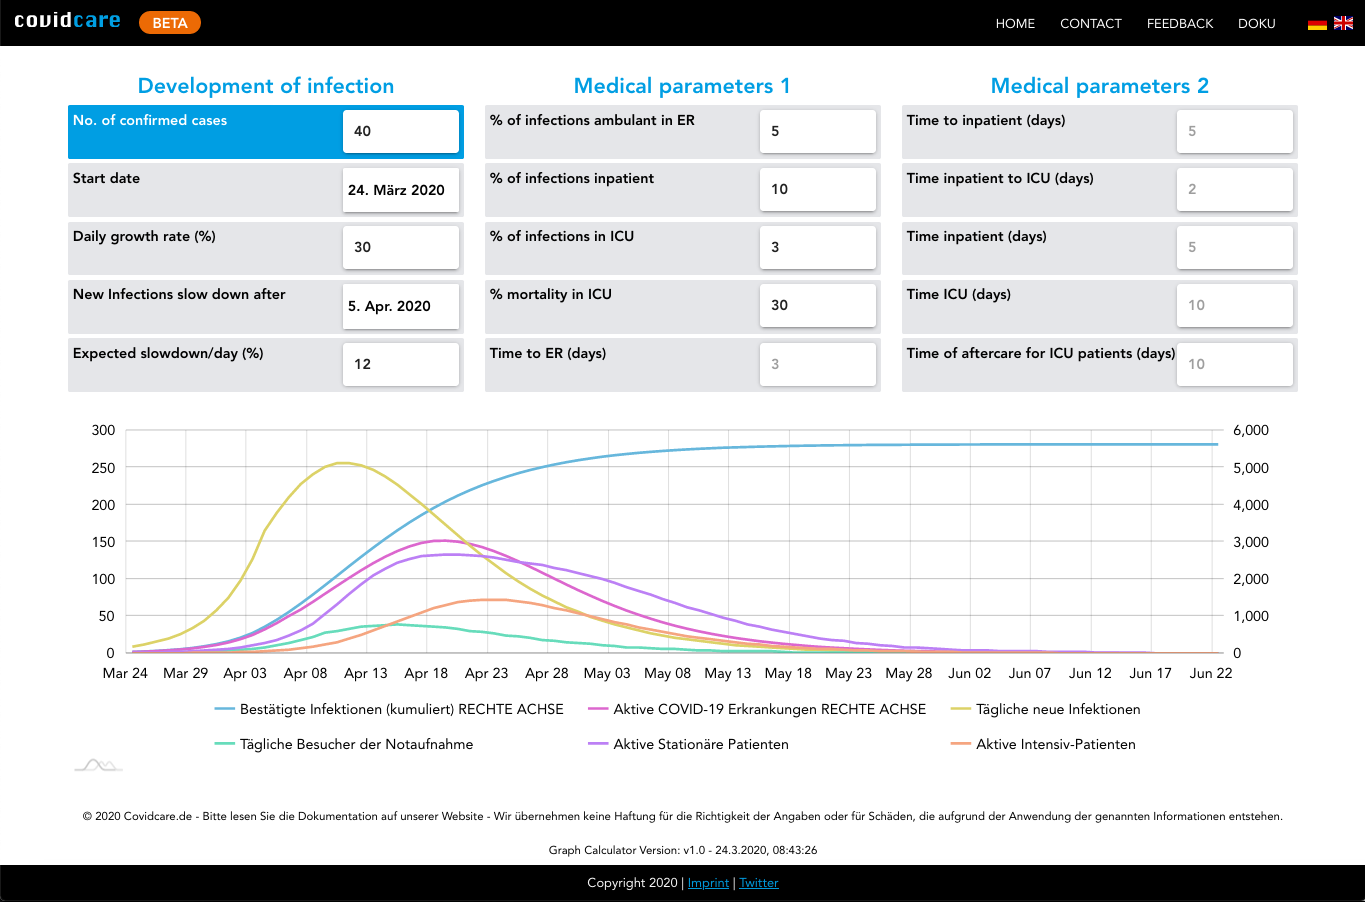
☝️ An important note: This online service was created with great care but also under extreme time pressure. We are very confident that the calculations provide useful insights and results – but cannot guarantee it. Also, the assumptions formulated in the calculation model are essentially based on the information published to date by renowned scientists and are subject to further changes. Therefore, please check all calculated results for your specific input data for plausibility. You, the user, determine how good the results are based on the quality of your input data. The underlying algorithm of the tool is simple and documented here.
Monday, May 4, 2020
Temukan solusi-solusi untuk membantu perusahaan anda di ASCI 8 Mei 2020
Temukan berbagai solusi untuk membantu perusahaan anda di masa pandemi ini, di acara
APTIKNAS Smart City & IoT Solutions during Covid-19 Pandemic
Segera register ke : https://www.eventcerdas.com/registrasipeserta.php?id=134
Tempat terbatas
#smartcity #IoT #aptiknas #eventcerdas #kotacerdas #kotacerdasindonesia

APTIKNAS Smart City & IoT Solutions during Covid-19 Pandemic
Segera register ke : https://www.eventcerdas.com/registrasipeserta.php?id=134
Tempat terbatas
#smartcity #IoT #aptiknas #eventcerdas #kotacerdas #kotacerdasindonesia

Subscribe to:
Posts (Atom)
Map Security needs to DevSecOps tools in SDLC.
Map Security needs to DevSecOps tools in SDLC. Implementing DevSecOps effectively into the SDLC involves adopting the right tools, adaptin...

-
http://blog.dayaciptamandiri.com/2014/03/lagi-51-free-system-and-network-tools.html Wednesday, February 26, 2014 : Recently, we did a ...
-
 Map Security needs to DevSecOps tools in SDLC. Implementing DevSecOps effectively into the SDLC involves adopting the right tools, adaptin...

